


- Home
- INVESTOR RELATIONS
- FINANCIAL INFORMATION
- FINANCIAL HIGHLIGHT
INVESTOR RELATIONS

FINANCIAL HIGHLIGHT
-
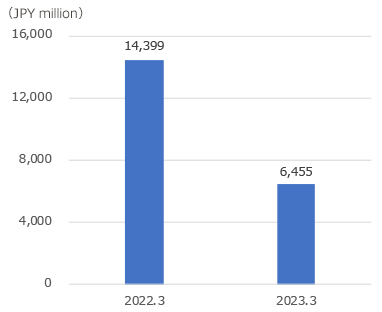
Revenue
-
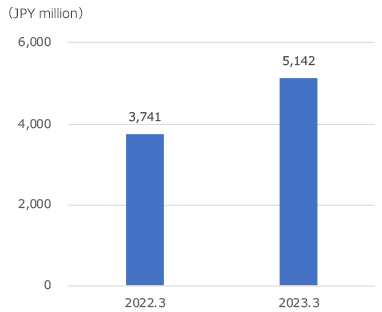
Gross profit
-
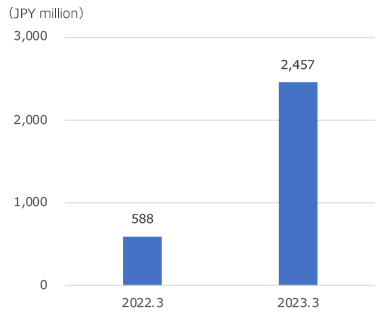
Operating profit
-
Owners of parent
-
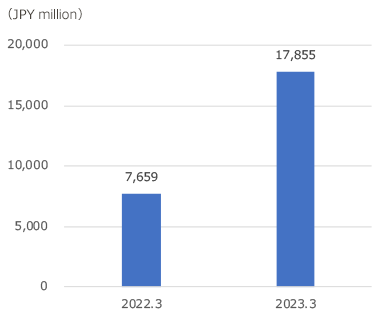
Assets
-
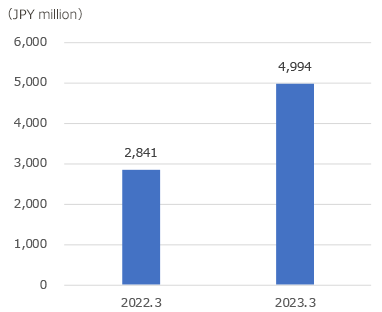
Equity attributable to owners of parent
-
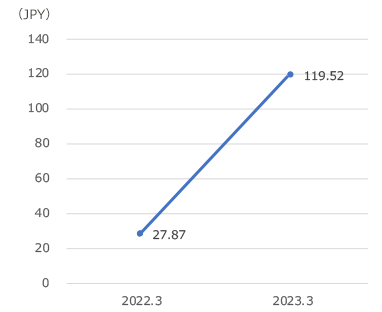
Basic earnings per share
-
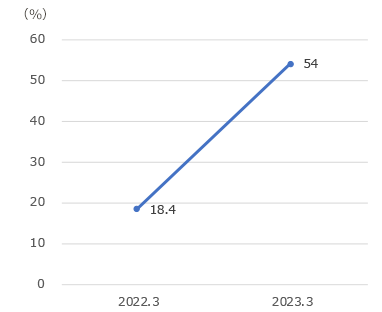
ROE
Income statement
(Unit: JPY thousand)
| FY2021 | FY2022 | |
|---|---|---|
| Revenue | 14,399,385 | 6,445,074 |
| Cost of Sales | 10,657,415 | 1,312,727 |
| Gross profit | 3,741,970 | 5,142,347 |
| SG&A | 2,909,378 | 4,006,584 |
| Other income | 2,868 | 1,683,262 |
| Other expenses | 247,265 | 361,912 |
| Operating profit | 588,195 | 2,457,113 |
| Finance income | 155,261 | 19,961 |
| Finance costs | 26,200 | 198,066 |
| Profit before tax | 717,256 | 2,279,008 |
| Income tax expense | 177,745 | 168,308 |
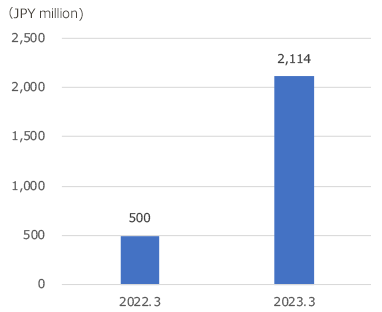
| Profit | 539,511 | 2,110,699 |
Statement of financial position
(Unit: JPY thousand)
| FY2021 | FY2022 | |
|---|---|---|
| Assets | 7,659,487 | 17,855,154 |
| Current Assets | 3,801,621 | 5,671,516 |
| Non-current assets | 3,857,866 | 12,183,637 |
| Liabilities | 4,775,262 | 12,821,986 |
| Current Liabilities | 3,649,870 | 10,328,164 |
| Non-current liabilities | 1,125,391 | 2,493,821 |
| Equity | 2,884,225 | 5,033,168 |
| Equity attributable to owners of parent | 2,841,894 | 4,994,852 |
| Non-controlling interests | 42,330 | 38,316 |
Cash flow statement
(Unit: JPY thousand)
| FY2021 | FY2022 | |
|---|---|---|
| Cash Flows from Operating Activities | 1,235,891 | 1,389,468 |
| Cash Flows from Investing Activities | △ 1,202,642 | △ 5,967,149 |
| Cash Flows from Financing Activities | 316,409 | 5,926,344 |
Various indicators
| FY2021 | FY2022 | |
|---|---|---|
| EPS(JPY) | 27.87 | 119.52 |
| Capital adequacy ratio | 37.1% | 28.0% |
| ROE | 18.4% | 54.0% |
| number of employees (Regular employee)(people) |
346 | 566 |
| Annual average number of temporary workers(people) | 84 | 100 |
Notes:
・The International Financial Reporting Standards (IFRS) were adopted from the 13th fiscal year (the fiscal year ended March 31, 2023).
Figures for the 12th fiscal year (the fiscal year ended March 31, 2022) have been reclassified into IFRS.
・The International Financial Reporting Standards (IFRS) were adopted from the 13th fiscal year (the fiscal year ended March 31, 2023).
Figures for the 12th fiscal year (the fiscal year ended March 31, 2022) have been reclassified into IFRS.

![]()