


- Home
- INVESTOR RELATIONS
- FINANCIAL INFORMATION
- FINANCIAL HIGHLIGHT
INVESTOR RELATIONS

FINANCIAL HIGHLIGHT
-
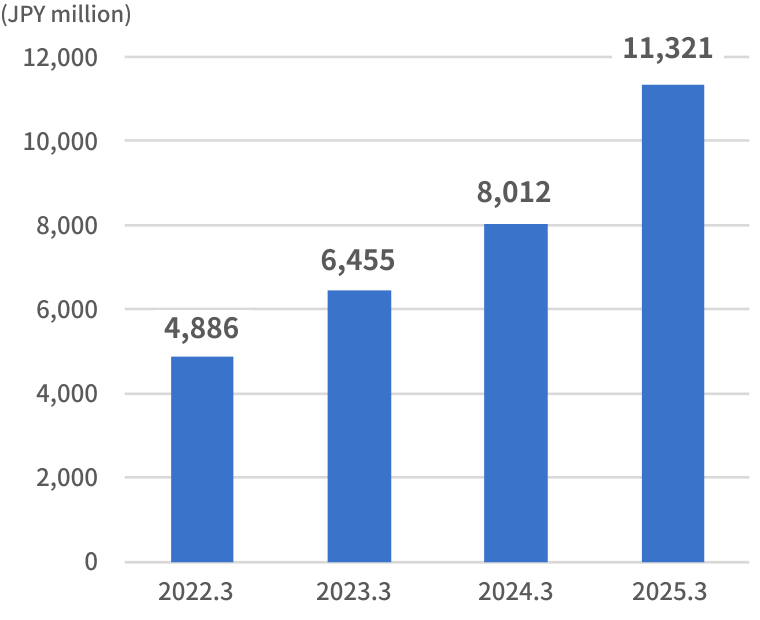
Revenue
-
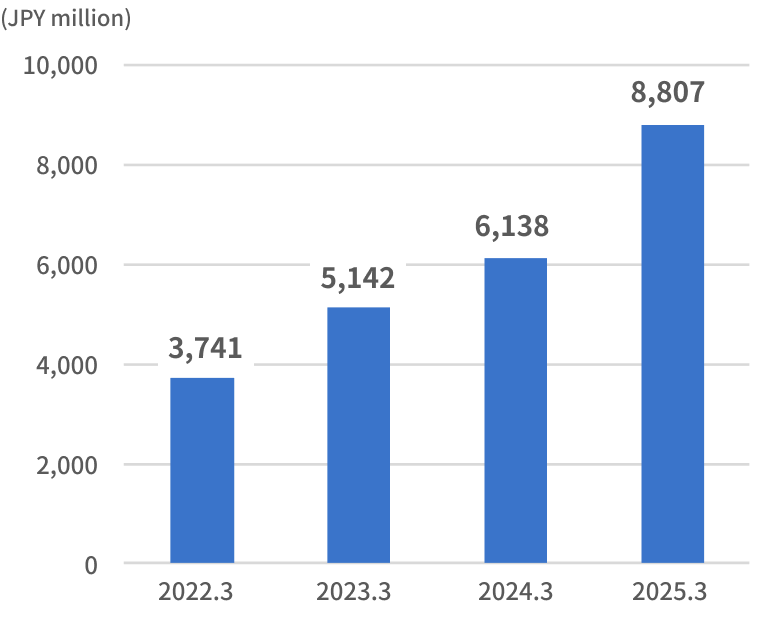
Gross profit
-
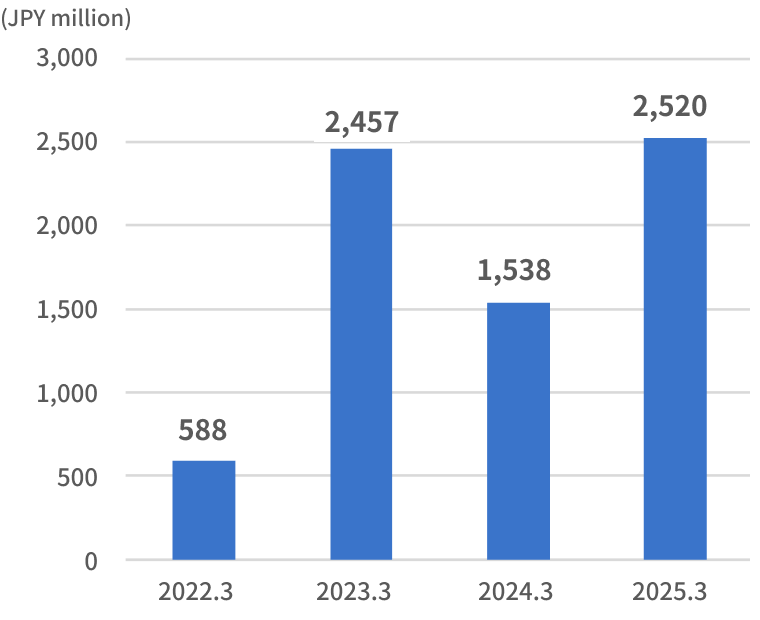
Operating profit
-
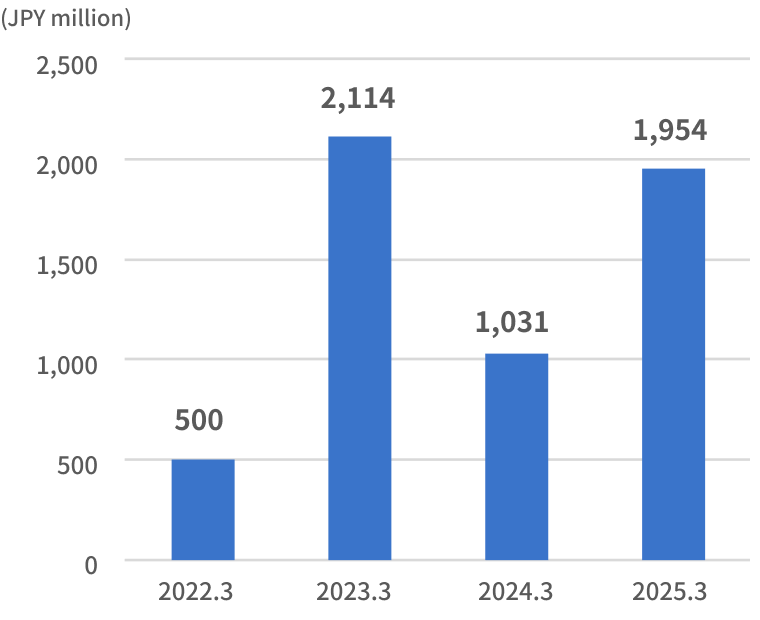
Owners of parent
-
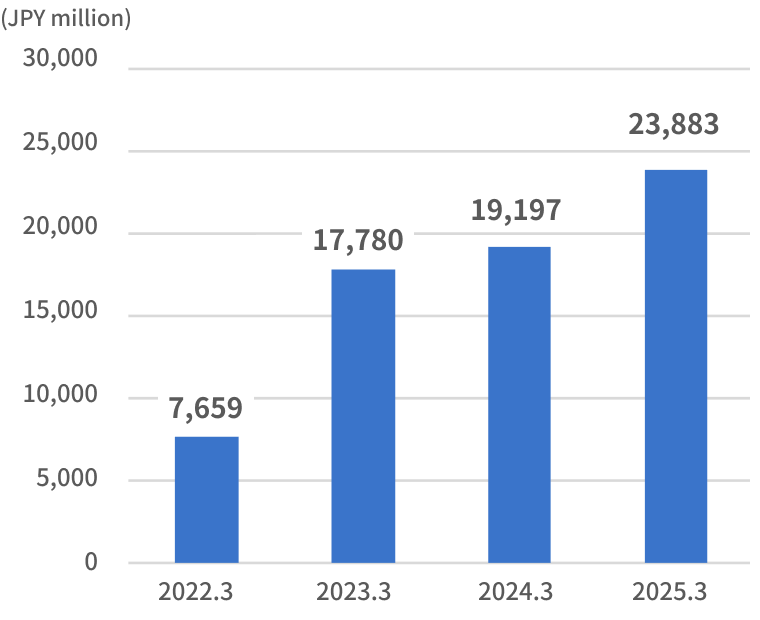
Assets
-
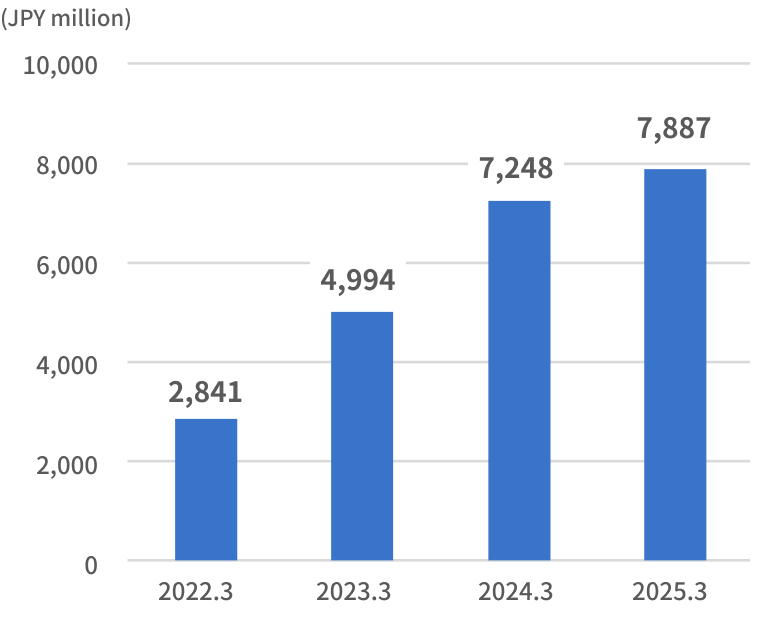
Equity attributable to owners of parent
-
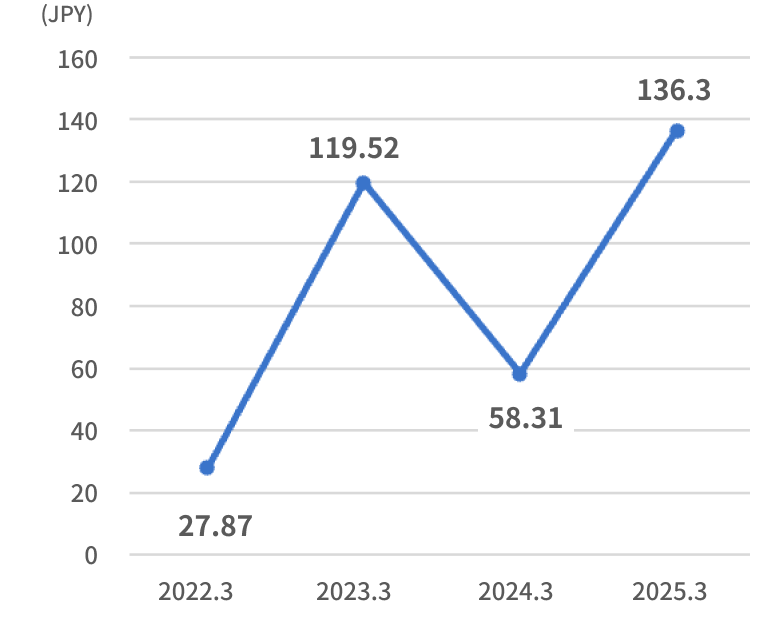
Basic earnings per share
-
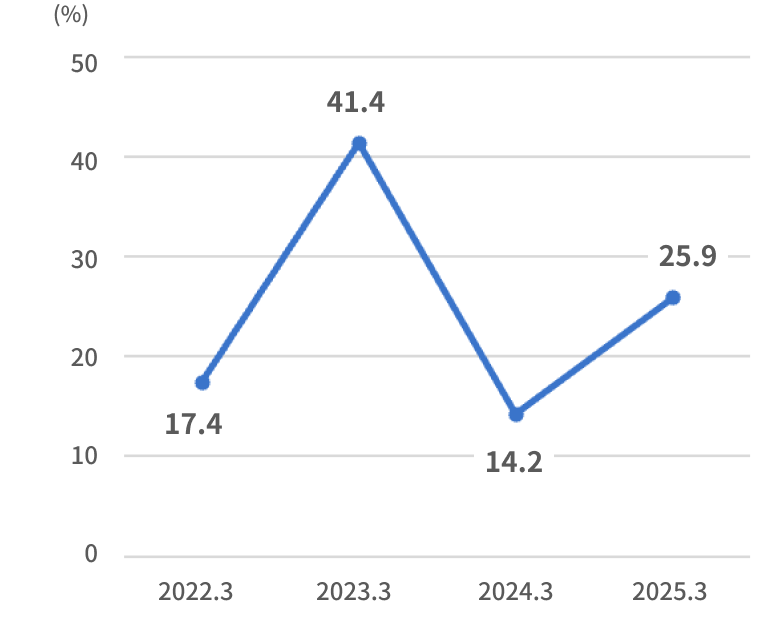
ROE
Income statement
(Unit: JPY thousand)
| FY2021 | FY2022 | FY2023 | FY2024 | |
|---|---|---|---|---|
| Revenue | 4,886,704 | 6,445,074 | 8,012,511 | 11,321,923 |
| Cost of Sales | 1,144,734 | 1,312,727 | 1,873,559 | 2,514,521 |
| Gross profit | 3,741,970 | 5,142,347 | 6,138,952 | 8,807,401 |
| SG&A | 2,909,378 | 4,006,584 | 5,252,860 | 7,244,554 |
| Other income | 2,868 | 1,683,262 | 676,223 | 1,138,245 |
| Other expenses | 247,265 | 361,912 | 23,321 | 180,483 |
| Operating profit | 588,195 | 2,457,113 | 1,538,994 | 2,520,609 |
| Equity in earnings (losses) of affiliates | ー | ー | ー | (96,815) |
| Finance income | 155,261 | 19,961 | 31,173 | 9,960 |
| Finance costs | 26,200 | 198,066 | 292,987 | 166,318 |
| Profit before tax | 717,256 | 2,279,008 | 1,277,180 | 2,267,436 |
| Income tax expense | 177,745 | 168,308 | 242,137 | 218,943 |
| Profit | 539,511 | 2,110,699 | 1,035,043 | 2,048,492 |
Statement of financial position
(Unit: JPY thousand)
| FY2021 | FY2022 | FY2023 | FY2024 | |
|---|---|---|---|---|
| Assets | 7,659,487 | 17,780,313 | 19,197,059 | 23,883,632 |
| Current Assets | 3,801,621 | 5,635,120 | 5,943,973 | 7,887,185 |
| Non-current assets | 3,857,866 | 12,145,193 | 13,253,086 | 15,996,446 |
| Liabilities | 4,775,262 | 12,746,566 | 11,906,897 | 15,181,124 |
| Current Liabilities | 3,649,870 | 10,252,744 | 4,876,337 | 7,367,749 |
| Non-current liabilities | 1,125,391 | 2,493,821 | 7,030,559 | 7,813,374 |
| Equity | 2,884,225 | 5,033,746 | 7,290,162 | 8,702,508 |
| Equity attributable to owners of parent | 2,841,894 | 4,995,430 | 7,248,376 | 7,887,322 |
| Non-controlling interests | 42,330 | 38,316 | 41,786 | 815,185 |
Cash flow statement
(Unit: JPY thousand)
| FY2021 | FY2022 | FY2023 | FY2024 | |
|---|---|---|---|---|
| Cash Flows from Operating Activities | 1,235,891 | 1,389,468 | 1,139,702 | 2,231,377 |
| Cash Flows from Investing Activities | (1,202,642) | (5,967,149) | (831,131) | (1,146,666) |
| Cash Flows from Financing Activities | 316,409 | 5,926,344 | (836,984) | (777,658) |
Various indicators
| FY2021 | FY2022 | FY2023 | FY2024 | |
|---|---|---|---|---|
| EPS(JPY) | 27.87 | 119.52 | 58.31 | 136.30 |
| Capital adequacy ratio | 37.1% | 28.0% | 37.8% | 33.0% |
| ROE | 17.4% | 41.4% | 14.2% | 25.9% |
| number of employees (Regular employee)(people) |
346 | 566 | 617 | 877 |
| Annual average number of temporary workers(people) | 84 | 100 | 116 | 317 |
Notes:
・Until the fiscal year ending March 2022, the revenue from the advertising platform business was recorded on a gross basis. Therefore, starting from the fiscal year ending March 2023, the revenue is presented on a net basis to align with this change.
・Until the fiscal year ending March 2022, the revenue from the advertising platform business was recorded on a gross basis. Therefore, starting from the fiscal year ending March 2023, the revenue is presented on a net basis to align with this change.


